| SCHEDULE 14A | ||||
| Proxy Statement Pursuant to Section 14(a) of the Securities Exchange Act of 1934 | ||||

| WINNEBAGO INDUSTRIES, INC. | ||
| (Name of Registrant as Specified in Its Charter) | ||
| (Name of Person(s) Filing Proxy Statement, if Other than the Registrant) | ||
| 1) | Title of each class of securities to which transaction applies: |
| 2) | Aggregate number of securities to which transaction applies: |
| 3) | Per unit price or other underlying value of transaction computed pursuant to Exchange Act Rule 0-11 (set forth the amount on which the filing fee is calculated and state how it was determined): |
| 4) | Proposed maximum aggregate value of transaction: |
| 5) | Total fee paid: |
| 1) | Amount previously paid: |
| 2) | Form, Schedule or Registration Statement No.: |
| 3) | Filing party: |
| 4) | Date filed: |
| BOARD RECOMMENDATIONS | ||||
| 1 | Elect three Class | |||
| FOR | ||
| Approve, on an advisory basis, the | FOR | |||
| 3 | Approve the 2019 Omnibus Incentive Plan; | FOR | ||
| 4 | Ratify the selection of Deloitte & Touche LLP as our independent registered public accountant for |
| FOR | ||||
| Act on any other | ||||
| By Order of the Board of Directors | |||
| /s/ | |||
| and Secretary | |||
| October | |||
| Page | |
| Vote Required | Voting Options(1) | Board Recommend-ation(2) | Broker Discretionary Voting Allowed(3) | |
Item 1: Elect three Class I directors to hold office for a three-year term | Plurality of the votes cast(4) | FOR WITHHOLD | FOR | No |
Item 2: Advisory approval of executive compensation (the "Say on Pay" vote) | Majority of the votes cast(5) | FOR AGAINST ABSTAIN | FOR | No |
Item 3: Approve the 2019 Omnibus Incentive Plan | Majority of the votes cast | FOR AGAINST ABSTAIN | FOR | No |
Item 4: Ratify the appointment of Deloitte & Touche LLP as our independent registered public accountant for the fiscal year ending August 31, 2019 | Majority of the votes cast | FOR AGAINST ABSTAIN | FOR | Yes |
| Name and Address of Beneficial Owner | Shares of Common Stock Owned Beneficially | % of Common Stock(1) | |
Royce & Associates, LLC 745 Fifth Avenue New York, New York 10151 | 3,041,377 | (2) | 11.3% |
BlackRock, Inc. 55 East 52nd Street New York, New York 10055 | 2,724,023 | (3) | 10.1% |
Invesco Ltd. 1555 Peachtree Street NE Suite 1800 Atlanta, GA 30309 | 2,420,556 | (4) | 9.0% |
Cooke & Bieler LP 1700 Market Street Suite 3222 Philadelphia, PA 19103 | 2,075,450 | (5) | 7.7% |
Franklin Resources, Inc. One Franklin Parkway San Mateo, California 94403 | 1,798,750 | (6) | 6.7% |
| Name and Address of Beneficial Owner | Amount and Nature of Beneficial Ownership | % of Common Stock(1) | |
BlackRock, Inc. 55 East 52nd Street New York, NY 10055 | 3,849,851 shares of Common Stock | (2) | 12.07% |
Dimensional Fund Advisors LP Building One 6300 Bee Cave Road Austin, TX 78746 | 1,836,098 shares of Common Stock | (3) | 5.76% |
| (1) | Based on |
| (2) |
| (3) |
| Name | Shares of Common Stock Owned Beneficially(1)(2) | Exercisable Stock Options | Winnebago Stock Units(2) | Total Shares of Common Stock Owned Beneficially(1) | % of Common Stock(3) | |||||
Christopher J. Braun (4) | — | — | — | — | (5) | |||||
| Robert M. Chiusano | 19,960 | — | 22,412 | 42,372 | (5) | |||||
| Jerry N. Currie | 21,000 | — | — | 21,000 | (5) | |||||
| S. Scott Degnan | 33,860 | — | — | 33,860 | (5) | |||||
| Lawrence A. Erickson | 18,000 | — | 32,613 | 50,613 | (5) | |||||
| William C. Fisher | 6,000 | — | 3,427 | 9,427 | (5) | |||||
| Scott C. Folkers | 33,717 | — | — | 33,717 | (5) | |||||
| Michael J. Happe | 10,000 | — | — | 10,000 | (5) | |||||
| Daryl W. Krieger | 40,981 | — | — | 40,981 | (5) | |||||
David W. Miles (4) | — | — | — | — | (5) | |||||
| Sarah N. Nielsen | 53,830 | — | — | 53,830 | (5) | |||||
| Martha T. Rodamaker | 11,500 | — | 8,449 | 19,949 | (5) | |||||
| Mark T. Schroepfer | 29,500 | — | 2,549 | 32,049 | (5) | |||||
| Directors and executive officers as a group (17 persons) | 341,215 | — | 69,450 | 410,665 | 1.5 | % | ||||
| Name | Shares of Common Stock Owned Outright | Exercisable Stock Options(1) | Winnebago Stock Units(2) | Total Shares of Common Stock Owned Beneficially | % of Common Stock(3) | ||||
| Maria F. Blase | — | — | — | — | (4) | ||||
| Christopher J. Braun | 9,740 | — | — | 9,740 | (4) | ||||
| Stacy L. Bogart | 10,000 | — | — | 10,000 | (4) | ||||
| Robert M. Chiusano | 24,700 | — | 24,880 | 49,580 | (4) | ||||
| Donald J. Clark | 764,426 | — | — | 764,426 | 2.39 | ||||
| William C. Fisher | 16,740 | — | 7,134 | 23,874 | (4) | ||||
| Michael J. Happe | 40,802 | 36,203 | — | 77,005 | (4) | ||||
| Brian D. Hazelton | 12,999 | 7,412 | — | 20,411 | (4) | ||||
| Bryan L. Hughes | 12,787 | 3,718 | — | 16,505 | (4) | ||||
| David W. Miles | 6,740 | — | — | 6,740 | (4) | ||||
| Richard D. Moss | 5,140 | — | — | 5,140 | (4) | ||||
| John M. Murabito | 3,840 | — | — | 3,840 | (4) | ||||
| Martha T. Rodamaker | 16,240 | — | 12,051 | 28,291 | (4) | ||||
| Directors and executive officers as a group (18 persons) | 1,035,915 | 66,154 | 44,065 | 1,146,134 | 3.57(5) | ||||
| (1) | Includes shares |
| (2) | Winnebago Stock Units held under our Directors' Deferred Compensation Plan as of October |
| (3) | Based on |
| (4) | Less than 1%. |
| (5) | Includes 66,154 shares that directors and executive officers as a group have the right to acquire within 60 days of October |
| Committees of the Board | |||
| Audit | Human Resources | Nominating and Governance | |
Christopher J. Braun (1) | X | ||
Robert M. Chiusano (Chair) (1)(2) | X | ||
Jerry N. Currie (1) | X | ||
Lawrence A. Erickson (3) | X | X | |
William C. Fisher (1) | Chair | ||
David W. Miles (1) | X | X | |
Martha T. Rodamaker (1) | X | Chair | |
Mark T. Schroepfer (1)(3) | Chair | ||
| Number of meetings in Fiscal 2016 | 4 | 4 | 4 |
Conducted a self-assessment of its performance (4) | X | X | X |
| Committees of the Board | ||||
| Audit | Human Resources | Nominating and Governance | Finance | |
Maria F. Blase(1)(2) | X | X | ||
Christopher J. Braun (1) | X | X | ||
Robert M. Chiusano (Chair) (1) | X | X | ||
William C. Fisher (1) | X | Chair | ||
David W. Miles (1)(2) | X | Chair | ||
Richard D. Moss (1)(2) | Chair | X | ||
John M. Murabito (1) | Chair | X | ||
Martha T. Rodamaker (1) | X | X | ||
| Number of meetings in Fiscal 2018 | 7 | 5 | 5 | 5 |
| Conducted a self-assessment of its performance | X | X | X | X |
| (1) | Determined to be "independent" under applicable listing standards of the |
| (2) |
| Designated as an "audit committee financial expert" for purposes of Item 407, Regulation S-K under the Securities Act of 1933, as amended. |
| Audit Committee | Each year, the committee appoints the independent registered public accountant to examine our financial statements. It reviews with representatives of the independent registered public accountant the auditing arrangements and scope of the independent registered public accountant's examination of the books, results of those audits, any non-audit services, their fees for all such services and any problems identified by and recommendations of the independent registered public accountant regarding internal controls. Others in regular attendance for part of the Audit Committee meeting typically include: the Board Chair; the CEO; the CFO; the Vice President, General Counsel and Secretary; and the Corporate Controller. The Audit Committee meets at least annually with the CFO, the internal auditors and the independent auditors in separate executive sessions. The Audit Committee is also prepared to meet privately at any time at the request of the independent registered public accountant or members of our Management to review any special situation arising on any of the above subjects. The Audit Committee also performs other duties as set forth in its written charter which is available for review on the Corporate Governance portion of the Investor Relations section of our Web Site at http://www.winnebagoind.com. The Audit Committee annually reviews its written charter and recommends to the Board such changes as it deems necessary. | |
| Members | ||
| Richard D. Moss, Chair | ||
| Maria F. Blase | ||
| William C. Fisher | ||
| David W. Miles | ||
| Martha T. Rodamaker | ||
| Nominating and Governance Committee | The Nominating and Governance Committee's charter, which is available for review on the Corporate Governance portion of the Investor Relations section of our Web Site at http://www.winnebagoind.com, establishes the scope of the committee's duties to include: (1) adopting policies and procedures for identifying and evaluating director nominees, including nominees recommended by shareholders; (2) identifying and evaluating individuals qualified to become Board members, considering director candidates recommended by shareholders and recommending that the Board select the director nominees for the next annual meeting of shareholders; (3) establishing a process by which shareholders and other interested parties are able to communicate with members of the Board; (4) developing and recommending to the Board a Corporate Governance Policy applicable to the Company; and (5) reviewing and approving Related Person Transactions (as defined below). The committee recommended to the Board the director-nominees proposed in this Proxy Statement for election by the shareholders. The Nominating and Governance Committee reviews the qualifications of, and recommends to the Board, candidates to fill Board vacancies as they may occur during the year. The Nominating and Governance Committee will consider suggestions from all sources, including shareholders, regarding possible candidates for director. See also "Fiscal Year 2019 Shareholder Proposals" for a summary of the procedures that shareholders should follow to nominate a director. | |
| Members | ||
| William C. Fisher, Chair | ||
| Maria F. Blase | ||
| Christopher J. Braun | ||
| John M. Murabito | ||
Finance Committee | The Finance Committee's charter, which is available for review on the Corporate Governance portion of the Investor Relations section of our Web Site at http://www.winnebagoind.com, establishes the scope of the committee's duties to include: recommending to the Board financial policies, goals, and budgets that support the financial health, strategic goals, mission, and values of the Company, including the long-range financial plan of the Company, and annual capital budgets; evaluating major capital expenditures and financial transactions. The Finance Committee has oversight in the following specific areas: strategic transactions, capitalization and debt and equity offerings, capital expenditure plans, financial review of business plans, rating agencies and investor relations, dividends, share repurchase authorizations, investment policy, debt management, tax strategies, and financial risk management. | |
| Members | ||
| David W. Miles, Chair | ||
| Robert M. Chiusano | ||
| Richard D. Moss | ||
| Martha T. Rodamaker | ||
| Human Resources Committee | The Human Resources Committee's charter, which is available for review on the Corporate Governance portion of the Investor Relations section of our Web Site at http://www.winnebagoind.com, establishes the scope of the committee's duties to include: (1) reviewing and approving corporate goals and objectives relevant to compensation of our CEO, evaluating performance and compensation of our CEO in light of such goals and objectives and establishing compensation levels for other executive officers; (2) overseeing the evaluation of our executive officers (other than the CEO) and approving the general compensation program and salary structure of such executive officers; (3) administering and approving awards under our incentive compensation and equity-based plan; (4) reviewing and approving all executive officer compensation, including any executive employment agreements, severance agreements, and change in control agreements; (5) from time to time, reviewing the list of peer group companies used for compensation purposes; (6) reviewing and approving Board retainer fees, attendance fees, and other compensation, if any, to be paid to non-employee directors; (7) reviewing and discussing with Management the Compensation Discussion and Analysis section and certain other disclosures, including those relating to compensation advisors, compensation risk and the "say on pay" vote, as applicable for our Form 10-K and proxy statement; and (8) preparing the committee's annual report on executive compensation for our Form 10-K and proxy statement. Role of Executive Officers — In Fiscal 2018, the Human Resources Committee delegated authority to designated members of Management to approve employment compensation packages for certain employees, not including the Named Executive Officers (NEOs) (as defined below), under certain circumstances. During Fiscal 2018, Mr. Happe as CEO, recommended to the committee proposals for base salary, target short-term incentive levels, actual short-term incentive payouts and long-term incentive grants for select NEOs for Fiscal 2019. The committee separately considers, discusses, modifies as appropriate, and takes action on such proposals and determines the compensation of the CEO and other NEOs. See “Compensation Discussion and Analysis-Role of Executive Officers in Compensation Decisions” below for further detail. Role of Compensation Consultants — The Human Resources Committee has periodically utilized an outside compensation consultant for matters relating to executive compensation. In Fiscal 2018, the committee retained Willis Towers Watson through March 2018 and Semler Brossy Consulting Group LLC ("Semler Brossy") beginning in April 2018, to advise on certain executive compensation-related matters, as described further in the "Compensation Discussion and Analysis" Section. | |
| Members | ||
| John Murabito, Chair | ||
| Christopher J. Braun | ||
| Robert M. Chiusano | ||
| (1) | competitively bid or regulated public utility services transactions, |
| (2) | transactions involving trustee type services, |
| (3) | transactions in which the Related Person's interest arises solely from ownership of our equity securities and all equity security holders received the same benefit on a pro rata basis, |
| (4) | an employment relationship or transaction involving an executive officer and any related compensation solely resulting from that employment relationship or transaction if: |
| (i) | the compensation arising from the relationship or transaction is or will be reported pursuant to the SEC's executive and director compensation proxy statement disclosure rules; or |
| (ii) | the executive officer is not an immediate family member of another executive officer or director and such compensation would have been reported under the SEC's executive and director compensation proxy statement disclosure rules as compensation earned |
| (5) | if the compensation of or transaction with a director is or will be reported pursuant to the SEC's executive and director compensation proxy statement disclosure rules. |
| Director | Fees Earned or Paid in Cash(1) | Stock Awards(2) | All Other Compensation(3) | Total | Fees Earned or Paid in Cash(1)(2) ($) | Stock Awards(3) ($) | All Other Compensation(4) ($) | Total ($) | ||||||||||||||||||
| Irvin E. Aal | $ | 16,168 | $ | 119,100 | $ | — | $ | 135,268 | ||||||||||||||||||
| Christopher J. Braun | 35,484 | — | — | 35,484 | 75,000 | 95,016 | — | 170,016 | ||||||||||||||||||
| Robert M. Chiusano | 63,853 | 119,100 | — | 182,953 | 115,000 | 95,016 | — | 210,016 | ||||||||||||||||||
| Jerry N. Currie | 49,000 | 119,100 | — | 168,100 | ||||||||||||||||||||||
| Lawrence A. Erickson | 83,172 | 119,100 | — | 202,272 | ||||||||||||||||||||||
| William C. Fisher | 53,533 | 119,100 | — | 172,633 | 80,000 | 95,016 | �� | — | 175,016 | |||||||||||||||||
| David W. Miles | 35,484 | — | — | 35,484 | 80,000 | 95,016 | — | 175,016 | ||||||||||||||||||
| Richard D. Moss | 82,500 | 95,016 | — | 177,516 | ||||||||||||||||||||||
| John M. Murabito | 78,750 | 95,016 | — | 173,766 | ||||||||||||||||||||||
| Martha T. Rodamaker | 53,533 | 119,100 | — | 172,633 | 76,250 | 95,016 | — | 171,266 | ||||||||||||||||||
| Mark T. Schroepfer | 59,000 | 119,100 | — | 178,100 | ||||||||||||||||||||||
Mark T. Schroepfer(5) | 23,669 | 113,634 | 17,593 | 154,896 | ||||||||||||||||||||||
| (1) | Our directors may elect to receive retainer fees in cash or may defer their retainer fees into the Directors' Deferred Compensation Plan. |
| (2) |
| (3) |
| (4) | Other than Mr. Schroepfer, none of the directors received perquisites and other personal benefits in an aggregate amount of $10,000 or more. Mr. Schroepfer received his award on December 6, 2017 and he received a cash payment of $17,593 in December 2017 to offset lost income related to the delay in receiving his stock award (due to an inability to make an 83(b) tax election at the time he should have received his grant in October of 2017). |
| (5) | Mr. Schroepfer's service on the Board terminated upon the expiration of his term on December 12, 2017. |
| Director | Restricted Stock Awards | Stock Units |
| Christopher J. Braun | 4,740 | 0 |
| Robert M. Chiusano | 20,240 | 24,605 |
| William C. Fisher | 16,740 | 6,751 |
| David W. Miles | 4,740 | 0 |
| Richard D. Moss | 2,140 | 0 |
| John M. Murabito | 2,140 | 0 |
| Martha T. Rodamaker | 16,240 | 11,692 |
| Maria F. Blase | ||
  | Committees Ÿ Audit Ÿ Nominating and Governance Age: 51 Director Since: 2018 | |
Maria F. Blase, 51, currently serves as President of the Fluid Management, Material Handling and Power Tools businesses of Ingersoll Rand, a global industrial manufacturing company. Maria has 25 years of experience with diverse industries, including transport, buildings, services, manufacturing, pharmaceuticals and mining. After joining Ingersoll Rand in 1999, she was promoted to global financial roles of increasing importance, including chief financial officer of the $8 billion Climate Solutions sector. In 2013, she was named President of the HVAC and Transport Latin America business of Ingersoll Rand, and in late 2017 assumed her most recent role. Ms. Blase is a CPA and her previous experience includes various positions at KPMG LLP from 1993 to 1999 in increasing scope and complexity. Due to Ms. Blase's relevant experience in finance, accounting and controls, the Board determined that she is an audit committee financial expert. | ||
| Skills and Qualifications: | ||
| Ms. Blase brings to the Board extensive experience in international, strategic planning, acquisitions and driving business growth. The Board believes her financial and business expertise will add valuable insights to the Board. | ||
| Christopher J. Braun | ||
 | Committees Ÿ Ÿ Nominating and Governance Age: 58 Director Since: 2015 | |
| Christopher J. Braun, 58, has been a director since 2015. Mr. Braun has over 30 years of leadership experience encompassing manufacturing, finance and sales. He founded Teton Buildings in 2008 and held the position of CEO through 2013. His previous experience includes CEO of Teton Homes, Executive Vice President - RV Group at Fleetwood Enterprises and various senior management positions within PACCAR Corporation, manufacturer of Kenworth and Peterbilt trucks. | ||
| Skills and Qualifications: | ||
| As a recognized leader in the RV industry, Mr. | ||
 | |
 | |
 | |
| David W. Miles | ||
 | Committees Ÿ Audit Ÿ Finance (Chair) Age: 61 Director Since: 2015 | |
| David W. Miles, 61, a financial adviser, entrepreneur and investor, has been a director since 2015. Mr. Miles is co-founder and Managing Principal of ManchesterStory Group, an early-to-growth stage venture capital firm, chairman and principal owner of Miles Capital, Inc., a registered investment advisory firm managing investments in public equities, public debt and alternative asset classes to institutional investors, and founder and manager of The Miles Group, LLC, a firm focused on direct and indirect private equity investments. He is also a director of the Miles Funds, Inc., and a director and chair of the Audit Committee of Northwest Financial Corporation. Due to Mr. Miles' vast experience in finance and as an investment advisor, the Board determined that he is an audit committee financial expert. | ||
| Skills and Qualifications: | ||
| Mr. Miles brings legal and investment transaction experience to the Board. He also brings significant expertise in financial reporting and capital allocation strategy. | ||
| Robert M. Chiusano | ||
 | Committees Ÿ Human Resources Ÿ Finance Age: 67 Director Since: 2008 | |
| Robert M. Chiusano, 67, has been a director since 2008 and was elected as Chairman of the Board in 2016. Mr. Chiusano has served as a principal in RMC Consulting, LLC, a company focused on leadership development and operational excellence, since 2007. Mr. Chiusano previously served as Executive Vice President and Special Assistant to the CEO and a former Executive Vice President and Chief Operating Officer of both the Government and Commercial Systems business segments of Rockwell Collins, Inc. Mr. Chiusano also currently serves as an adjunct professor in the University of Iowa College of Engineering where he has served since 2001 and is a member of the Coe College Board of Trustees where he serves as the Chairman of the College Relations Committee. | ||
| Skills and Qualifications: | ||
| As the former Chief Operating Officer of both Government and Commercial Systems of Rockwell Collins, Inc., Mr. Chiusano brings senior level business leadership and strategic planning skills and an operating background to the Board. As principal of RMC Consulting, LLC, he also brings leadership development and operational excellence skills to the Board. | ||
| Richard (Rick) D. Moss | ||
 | Committees Ÿ Audit (Chair) Ÿ Finance Age: 60 Director Since: 2017 | |
| Richard (Rick) D. Moss, 60, was appointed to the Board of Directors in February 2017. Most recently, Mr. Moss served as the Chief Financial Officer of Hanesbrands, Inc., a leading global basic apparel manufacturer, from 2011 until his retirement on December 31, 2017. Mr. Moss joined Hanesbrands as Senior Vice President - Finance and Treasurer and had several roles increasing in scope and complexity prior to becoming Chief Financial Officer. Prior to his roles at Hanesbrands, Mr. Moss served as CFO of Chattem Inc., a consumer products company. Mr. Moss has been a director of Nature's Sunshine Products, Inc. since May 2018, and also serves as a director for the Center for Creative Entrepreneurship and Chair of the Board of Trustees of The Arts Council of Winston-Salem/Forsyth County. Due to Mr. Moss' relevant experience in finance, accounting, and auditing, the Board determined he is an audit committee financial expert. | ||
| Skills and Qualifications: | ||
| With his many years of experience as a chief financial officer and executive at a public company, Mr. Moss provides the Board expertise in financial and strategic planning, mergers, acquisitions and integration of businesses following mergers and acquisitions, as well as capital allocation strategies and complex financial issues. | ||
| John M. Murabito | ||
 | Committees Ÿ Human Resources (Chair) Ÿ Nominating and Governance Age: 59 Director Since: 2017 | |
| John M. Murabito, age 59, was appointed to the Board of Directors in May 2017. He has served as the Executive Vice President and Chief Human Resources Officer of Cigna Corporation, a health insurance company, since 2003. His other Human Resource leadership roles have included Chief Human Resources Officer at Monsanto Company and Group Vice President, Human Resources for Frito-Lay, Inc., a division of PepsiCo. Mr. Murabito is a Fellow and Chair of the National Academy of Human Resources, a Member of the Boards of Trustees of the Human Resources Policy Association and the American Health Policy Association, and serves as Chair of the Board of Trustees for Augustana College in Rock Island, Illinois. | ||
| Skills and Qualifications: | ||
| Mr. Murabito brings strong executive leadership and talent management expertise to our Board as a senior executive of a public company. He provides valuable insights on human capital, executive compensation, leadership development and succession planning to the Board. | ||
| Michael J. Happe | ||
 | Age: Director Since: 2016 | |
| Michael J. Happe, 47, joined Winnebago | ||
| Skills and | ||
| Mr. Happe's knowledge of all aspects of the business | ||
 | William C. Fisher | ||
 | Committees Ÿ Audit Ÿ Nominating and Governance (Chair) Age: Director Since: 2015 | ||
| William C. Fisher, 64, a retired business executive, has been a director since March 2015. Mr. Fisher was the Chief Information Officer from 1999 until 2007 of Polaris industries Inc., a manufacturer of power sports products. He was Vice President and | |||
| Skills and Qualifications: | |||
| Mr. Fisher's experience | |||
 | |
| ▪ | Align the interests of management with those of shareholders; |
| ▪ | Provide fair and competitive compensation; |
| ▪ | Integrate compensation with our business plans; |
| ▪ | Reward both business and individual performance; and |
| ▪ | Attract and retain key executives critical to our success. |
Performance(1) | ||||
Long-Term(2) | 1-year | 3-year(3) | ||
| 29.3% | ||||
| $166,596 | ||||
| 13.4% | ||||
| Performance Objective | Link to 2018 Compensation | ||||
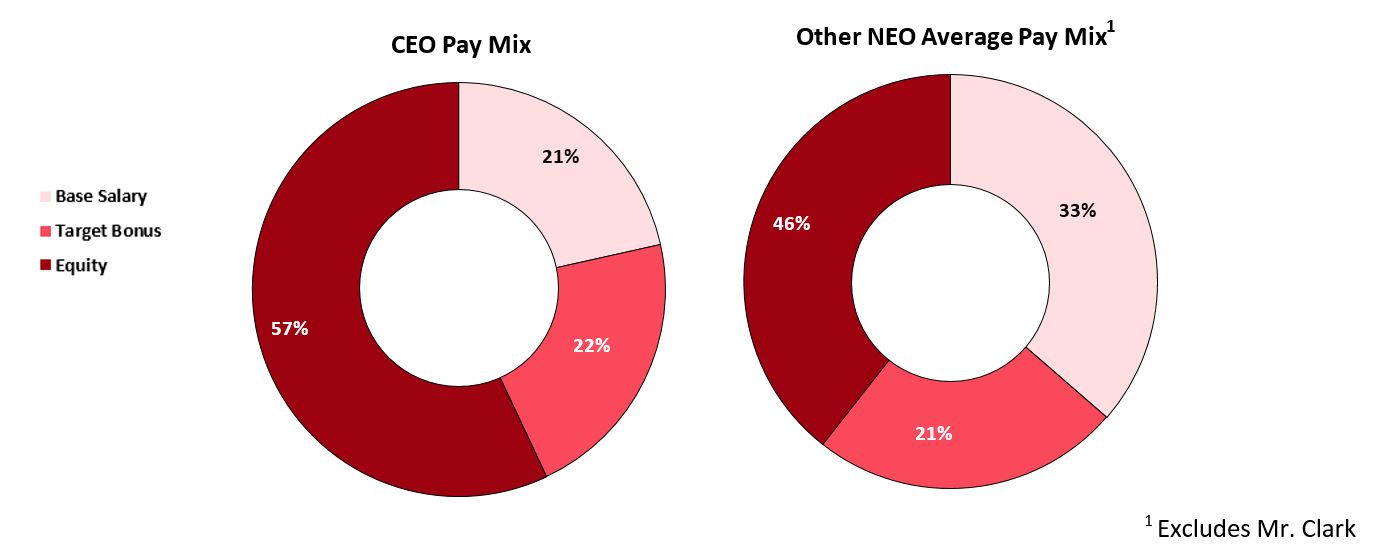
| Financial | Ÿ Ÿ Ÿ | For our CEO, Mr. Happe, 100% of 2018 annual incentive awards was based on achieving targeted levels of net sales growth (50%), operating income (40%), and working capital (10%) at the company level. For all NEOs other than Mr. Clark, 90% of 2018 annual incentive awards was tied to these metrics at either the company or business unit level. The other 10% was tied to individual metrics aligned with goals deemed important to advancing business objectives. Pursuant to the terms of his employment agreement, Mr. Clark's incentive compensation is tied 100% to the pretax net income of the Grand Design business that is part of our Towables segment. In addition, vesting for the Fiscal 2016-2018 LTIP awards was tied 100% to our three-year average ROE. | |||
| Total Shareholder Returns | Ÿ Ÿ | With the exception of Mr. Clark, 46% of our NEO compensation on average was delivered in the form of company equity awards (57% in the case of our CEO). 25% of the annual equity grants made in Fiscal 2018 were in the form of stock options, which only have value to the executive if the value of the Company grows for our shareholders. | |||
| What we do | ü ü ü ü ü ü ü ü | Tie the majority of target total compensation to performance Provide appropriate mix of fixed and variable pay to reward company, line of business, and individual performance Align executive interests with the interests of the shareholders through equity-based awards Include "clawback" provisions for each of the annual and long-term incentive programs, which provide for the recoupment of incentive compensation payouts following a restatement due to material noncompliance with financial reporting requirements Align our performance goals and measures with our strategy and operating plan Maintain meaningful executive and director stock ownership guidelines Conduct annual "say-on-pay" advisory votes Use an outside, independent third-party advisor to provide objective compensation advice | |||
| What we don't do | û û û û û û û | Provide excessive severance benefits to our executive officers Provide tax gross-ups, including excise tax gross-ups upon change in control Make equity awards subject to automatic acceleration of vesting (i.e., "single-trigger") upon change in control (as of Fiscal 2019) Allow for hedging or speculative trading of Company securities by executives or directors Reprice options without shareholder approval Provide significant perquisites Allow for pledging by our executives and directors | |||
| ▪ | Revised executive change in control agreements to (1) reduce severance multiples (for executives other than the CEO and Mr. Clark), (2) make severance payable only as to salary and target annual incentives (previous severance agreements provided for severance on total taxable compensation, including equity awards), (3) adjust the definition of Change in Control to align with current market practices, and (4) reduce the amount of time after a Change in Control that a termination of employment can trigger a severance obligation from three years to two years. |
| ▪ | Revised the equity award agreements so that all future equity awards will be subject to “double trigger” accelerated vesting following a change in control (i.e., vesting only accelerates following a change in control if the executive’s employment is also terminated) rather than the prior “single trigger” vesting provisions |
| ▪ | Increased the stock ownership guideline for our CEO from 4x salary to 5x salary |
| Element | Mechanics | Rationale | |
| Paid in Cash | Salary | Weekly payments Values correspond to experience and job scope | Provides competitive fixed pay to attract employees |
| Officers Incentive Compensation Plan (OICP) | Annual payout tied to performance against pre-determined metrics and goals across a one-year performance period For Fiscal 2018, the metrics included: Ÿ 90% financial objectives ú 50% Net Sales Growth ú 40% Operating Income ú 10% Net Working Capital Ÿ 10% Individual Objectives Payouts range from 0% - 200% of a pre-determined target value | Incentivizes achievement of key annual objectives at an enterprise-wide or individual business unit level - driving progress towards achievement of long-term initiatives | |
| Paid in Equity | Long-Term Incentive Program (LTIP) / Performance Shares | 50% of all annual Equity Awards For the Fiscal 2018-2020 performance period, payouts are tied to performance against pre-determined goals across a three-year performance period The metrics consist of: Ÿ 30% Net Sales Ÿ 30% Operating Income Ÿ 40% ROE Payouts range from 0% - 150% of a pre-determined target value | Rewards for achievement of specific long-term financial objectives Aligns NEOs' interest with long-term shareholder value creation |
| Stock Options | 25% of all annual Equity Awards Stock options can be exercised over ten years and vest over three years in equal installments | Aligns NEOs’ interest with long-term shareholder value creation as measured by appreciation in stock price from the date of grant | |
| Restricted Stock | 25% of all annual Equity Awards Restricted stock grants vest over three years in equal installments | Aligns NEOs’ interest with long-term shareholder value creation Encourages executive retention | |
| ▪ | Review of annual and long-term incentive designs and |
| Name | Fixed Compensation | Fixed Compensation | Performance-Based Compensation | ||
Michael J. Happe (1) | $ | 550,000 | 62% | 38% | |
| Sarah N. Nielsen | 335,000 | 55% | 45% | ||
| S. Scott Degnan | 305,000 | 54% | 46% | ||
| Scott C. Folkers | 278,999 | 55% | 45% | ||
| Daryl W. Krieger | 256,001 | 54% | 46% | ||
| ▪ | Review information provided to the Committee by management, and develop recommendations with respect to CEO compensation decisions and provide advice to the Committee on |
| ▪ | Attend and participate in |
| ▪ | Report on compensation trends and best practices, plan design, and the reasonableness of individual compensation awards |
| ▪ | Meet with the Committee and/ or its members without management present |
| ▪ | Developing, summarizing and presenting information and analyses to enable the Human Resources Committee to execute its responsibilities, as well as addressing specific requests for information from the Committee |
| ▪ | Attending Committee meetings as requested to provide information, respond to questions and otherwise assist the Committee |
| ▪ | Assisting the CEO in making preliminary recommendations of base salary structure, annual and LTI program design and target award levels for the NEOs and other employees eligible to receive annual |
| A. O. Smith | Polaris Industries |
| Alamo Group | REV Group |
| American Railcar Industries | Shiloh Industries |
| Blue Bird | Standard Motor Products |
| Federal Signal | Standex International |
| FreightCar America | Tennant Company |
| Gentherm Incorporated | The Toro Company |
| Graco | Thor Industries |
| LCI Industries | Wabash National |
| Patrick Industries | |
| Removed (6 companies) | Added (7 companies) |
| A.O. Smith | Altra Industrial Motion |
| Alamo Group | Brunswick |
| American Railcar Industries | Commercial Vehicle |
| FreightCar America | Cooper-Standard |
| Graco | Horizon Global |
| Standex International | Hyster-Yale |
| Spartan Motors | |
| ▪ | Experience of the executive |
| ▪ | Time in position |
| ▪ | Individual performance |
| ▪ | Level of responsibility for the executive |
| ▪ | Economic conditions, Company performance, financial condition and strategic goals |
| ▪ | Competitive market data provided by the Committee’s independent compensation consultant |
| Name | FY18 Salary | FY17 Salary | % Increase | |||||
| Michael J. Happe | $ | 675,000 | $ | 625,000 | 8.0 | % | ||
| Bryan L. Hughes | $ | 461,250 | $ | 450,000 | 2.5 | % | ||
| Stacy L. Bogart | $ | 415,000 | N/A | N/A | ||||
| Donald J. Clark | $ | 400,000 | $ | 400,000 | — | % | ||
| Brian D. Hazelton | $ | 477,400 | $ | 463,500 | 3.0 | % | ||
| FY18 Target OICP | FY18 Actual OICP | ||||||
| Name | FY18 Salary ($) | % of Salary | Target Award ($) | % of Target | $ | ||
| Michael J. Happe | 675,000 | 100 | % | 675,000 | 130.1 | % | 855,658 |
Bryan L. Hughes(1) | 461,250 | 70 | % | 322,875 | 126.6 | % | 405,277 |
Stacy L. Bogart(2) | 415,000 | 60 | % | 249,000 | 130.1 | % | 211,813 |
Donald J. Clark(3) | N/A | N/A | N/A | N/A | N/A | ||
Brian D. Hazelton(4) | 477,400 | 65 | % | 310,310 | 56.3 | % | 173,054 |
| ▪ | Net Sales Growth (50%) - focuses on overall enterprise and business unit growth and also drives customer focus |
| ▪ | Operating Income (40%) - reinforces the importance of profitable growth across the enterprise |
| ▪ | Net Working Capital (10%) - helps measure overall financial health of the enterprise |
| Metric | Weight | Threshold (16% Payout) | Target (100% Payout) | Maximum (200% Payout) | FY18 Performance | Actual Payout % (Weighted) | ||||||
| Net Sales Growth | 50 | % | 10.8 | % | 21.5 | % | 32.3 | % | 29.3 | % | 82.7 | % |
| Operating Income | 40 | % | $128,229 | $160,287 | $192,362 | $166,596 | 40.0 | % | ||||
| Net Working Capital | 10 | % | 14.1 | % | 12.8 | % | 11.5 | % | 13.4 | % | 7.4 | % |
| Total Payout Percentage | 130.1 | % | ||||||||||
| Metric | Weight |
| Net Sales | 30% |
| Operating Income | 30% |
| ROE | 40% |
| Total Equity | |||||||
| Name | LTIP / Performance Shares (50%) ($) | Restricted Shares (25%) ($) | Stock Options (25%) ($) | FY 2018 ($) | FY 2017 ($) | % Increase(1) | |
| Michael J. Happe | 828,104 | 414,074 | 414,062 | 1,656,241 | 1,252,145 | 32.3 | % |
| Bryan L. Hughes | 247,486 | 123,743 | 123,753 | 494,981 | 451,886 | 9.5 | % |
Stacy L. Bogart(2) | 146,653 | 554,500 | 0 | 701,153 | N/A | N/A | |
Donald J. Clark(3) | N/A | N/A | N/A | N/A | N/A | N/A | |
Brian D. Hazelton(4) | 243,578 | 121,789 | 121,802 | 487,170 | 608,468 | (19.9 | )% |
| Metric | Weight | Threshold (10% Payout) | Target (100% Payout) | Maximum (150% Payout) | FY 16-18 Performance | Actual Payout % |
| ROE (3-year cumulative) | 100.0% | 12.7% | 15.9% | 19.1% | 19.7% | 150.0% |
| Stock Ownership Guideline | ||
| Name | % of Salary | $ Value |
| Michael J. Happe | 500% | 3,125,000 |
| Bryan L. Hughes | 250% | 1,153,125 |
| Stacy L. Bogart | 250% | 1,037,500 |
| Donald J. Clark | 250% | 1,000,000 |
| Brian D. Hazelton | 250% | 1,193,500 |
| Name and Principal Position | Year | Salary ($) | Bonus ($) | Stock Awards(1) ($) | Option Awards(2) ($) | Non-Equity Incentive Plan Compensation(3) ($) | Changes in Pension Value and Non-qualified Deferred Compensation Earnings ($) | All Other Compensation ($)(4) | Total ($) |
| Michael Happe | 2018 | $657,692 | - | $1,242,179 | $414,062 | $855,658 | - | $44,082 | $3,213,673 |
| President, CEO | 2017 | $599,038 | - | $1,004,291 | $247,854 | $902,152 | - | $29,843 | $2,783,178 |
| 2016 | $338,461 | - | $758,835 | $115,800 | $225,280 | - | $2,218 | $1,440,594 | |
| Bryan L. Hughes | 2018 | $457,356 | - | $371,228 | $123,753 | $405,277 | - | $37,446 | $1,395,060 |
| Vice President, CFO | 2017 | $298,846 | - | $451,886 | - | $134,497 | - | $6,370 | $891,599 |
Stacy L. Bogart(5) | 2018 | $271,346 | $50,000 | $701,153 | - | $211,813 | - | $25,248 | $1,259,560 |
| Vice President, General | |||||||||
| Counsel and Secretary | |||||||||
| Donald J. Clark | 2018 | $400,000 | - | - | - | $4,574,055 | - | - | $4,974,055 |
| President, Grand Design | 2017 | $330,769 | - | - | - | $2,700,915 | - | - | $3,031,684 |
| Vice President, Winnebago | |||||||||
| Industries, Inc. | |||||||||
| Brian D. Hazelton | 2018 | $472,588 | - | $365,368 | $121,802 | $173,054 | - | $39,945 | $1,172,757 |
| Vice President and | 2017 | $558,827 | - | $551,208 | $57,260 | $207,298 | - | $23,089 | $1,397,682 |
| General Manager, | |||||||||
| Motorhomes | |||||||||
| (1) | The table below illustrates the three categories of stock awards as presented above: |
| Performance-Based Plans | ||||||||||||||
| Name | Fiscal Year | Non-Performance- Based Restricted Stock Grant(a) | Annual Incentive Plans(b) | LTIP / Performance Shares(c) | Total Stock Awards | |||||||||
| Michael J. Happe | 2018 | $ | 414,074 | $ | — | $ | 828,104 | $ | 1,242,179 | |||||
| 2017 | 370,937 | — | 633,354 | 1,004,291 | ||||||||||
| 2016 | 166,700 | 112,648 | 479,487 | 758,835 | ||||||||||
| Bryan L. Hughes | 2018 | 123,743 | — | 247,486 | 371,228 | |||||||||
| 2017 | 280,500 | — | 171,386 | 451,886 | ||||||||||
Stacy L. Bogart (d) | 2018 | 554,500 | — | 146,653 | 701,153 | |||||||||
| 2017 | — | — | — | — | ||||||||||
| Donald J. Clark | 2018 | — | — | — | — | |||||||||
| 2017 | — | — | — | — | ||||||||||
| 2016 | — | — | — | — | ||||||||||
| Brian D. Hazelton | 2018 | 121,789 | — | 243,578 | 365,368 | |||||||||
| 2017 | 292,110 | — | 259,098 | 551,208 | ||||||||||
| 2016 | — | — | — | — | ||||||||||
| (a) | These amounts represent non-performance based restricted stock granted pursuant to the 2014 Plan computed in accordance with ASC 718. The grant date fair value of each of the non-performance based awards was determined at the closing price of the Company's shares on the NYSE on the grant date without regard to estimated forfeitures related to service-based vesting conditions. |
| (b) | The amounts reported in this column do not reflect actual compensation realized by the NEOs in 2016. These amounts represent the fair value of the annual performance-based award, which was required to be paid in stock subject to a one-year holding period under the annual Officers Incentive Compensation Plan ("OICP") for 2016. The 2017 and 2018 OICPs have no stock component and are all cash. |
| (c) | The amounts shown represent the grant date fair value computed in accordance with FASB ASC 718 of the LTIP / performance share awards. The amounts shown for Fiscal 2018-2020 LTIP represent the values that are based on achievement of 100% of the target performance. Assuming achievement of the maximum 150% of target performance, the value of the Fiscal 2018-2020 LTIP awards would be: $1,242,156 for Mr. Happe; $371,229 for Mr. Hughes; $219,980 for Ms. Bogart; and $365,367 for Mr. Hazelton. Assumptions used in the calculation of the amounts reported in this column are included in Note 12 to the financial statements included in our 2018 Form 10-K. |
| (d) | Ms. Bogart joined the Company in January 2018. |
| (2) | The amounts shown represent the aggregate grant date fair values of the option grants. Assumptions used in the calculation of the amounts reported in this column are included in Note 12 to the financial statements included in our 2018 Form 10-K. |
| (3) | These amounts represent actual annual incentive plan award payouts made in cash to NEOs under the 2016, 2017 and 2018 OICPs. In the case of Mr. Clark, these amounts do not represent award payouts under such OICPs, but instead represent award payouts under the pre-existing Grand Design Management Incentive Plan that he participates in. |
| (4) | Amounts reported in this column for Fiscal 2018 include the following: |
| Name | Tax and Financial Planning | Car Allowance | Life Insurance Premiums | Dividend(1) | 401(k) Match | Total |
| Michael J. Happe | $8,183 | $18,400 | $952 | $9,277 | $7,270 | $44,082 |
| Bryan L. Hughes | $8,183 | $18,400 | $952 | $5,122 | $4,789 | $37,446 |
| Stacy L. Bogart | $8,183 | $7,846 | $952 | $3,000 | $5,267 | $25,248 |
| Donald J. Clark | _ | _ | _ | _ | _ | _ |
| Brian D. Hazelton | $8,183 | $18,400 | $952 | $4,031 | $8,379 | $39,945 |
| (5) | Ms. Bogart received a new hire stock award of 10,000 shares of restricted stock on January 2, 2018 and a pro-rated FY18-20 LTIP award with a target value of 3,303 shares. She also received a sign-on bonus of $50,000 on January 2, 2018. |
| Plan Name | Grant Date (3) | Estimated Future Payouts Under Non-Equity Incentive Plan Awards(1) | Estimated Future Payments Under Equity Incentive Plan Awards(2) | All Other Stock Awards: Number of Shares of Stock or Units (#) | All Other Option Awards: Number of Securities Underlying Options (#) | Exercise or Base Price of Option Awards ($/Sh) | Grant Date Fair Value of Stock and Option Awards(4) ($) | ||||||||||||
| Name | Threshold ($) | Target ($) | Maximum ($) | Threshold (#) | Target (#) | Maximum (#) | |||||||||||||
| Michael J. Happe | 2014 Plan | 10/18/17 | 28,015 | $44.40 | $414,062 | ||||||||||||||
| 2014 Plan | 10/18/17 | 9,326 | $414,074 | ||||||||||||||||
| 2018 OICP | 108,000 | 675,000 | 1,350,000 | ||||||||||||||||
| FY18-20 LTIP | 10/18/17 | 1,865 | 18,651 | 27,977 | |||||||||||||||
| Bryan L. Hughes | 2014 Plan | 10/18/17 | 8,373 | $44.40 | $123,753 | ||||||||||||||
| 2014 Plan | 10/18/17 | 2,787 | $123,743 | ||||||||||||||||
| 2018 OICP | 73,800 | 322,875 | 645,750 | — | |||||||||||||||
| FY18-20 LTIP | 10/18/17 | 557 | 5,574 | 8,361 | — | ||||||||||||||
| Stacy L. Bogart | 2014 Plan | - | - | ||||||||||||||||
| 2014 Plan | 1/2/18 | 10,000 | $554,500 | ||||||||||||||||
| 2018 OICP | 26,049 | 162,808 | 325,616 | ||||||||||||||||
| FY18-20 LTIP | 1/2/18 | 330 | 3,303 | 4,954 | |||||||||||||||
Donald J. Clark(5) | |||||||||||||||||||
| Brian D. Hazelton | 2014 Plan | 10/18/17 | 8,241 | $44.40 | $121,802 | ||||||||||||||
| 2014 Plan | 10/18/17 | 2,743 | $121,789 | ||||||||||||||||
| 2018 OICP | 76,384 | 310,310 | 620,620 | ||||||||||||||||
| FY18-20 LTIP | 10/18/17 | 548 | 5,486 | 8,229 | |||||||||||||||
| (1) | Fiscal 2018 OICP targets annual performance against goals established by the Committee. Awards under the Fiscal 2018 OICP are payable in cash. The Threshold, Target and Maximum amounts presented above represent amounts that could have been earned by our NEOs for Fiscal 2018 under the Fiscal 2018 OICP. Ms. Bogart's Fiscal 2018 OICP has been prorated to reflect her January 2018 start date. |
| (2) | Fiscal 2018-2020 LTIP refers to our performance shares. For each of the NEOs, the Threshold, Target and Maximum amounts under the Fiscal 2018-2020 LTIP represent potential performance stock payments that are measured over a three-year performance period from August 30, 2017 through August 25, 2020. |
| (3) | The Human Resource Committee approved the Fiscal 2018 OICP and Fiscal 2018-2020 LTIP plans on October 18, 2017, effective as of August 27, 2017. |
| (4) | The grant date value per share of the restricted stock was $44.40 on October 18, 2017 and $55.40 on January 2, 2018, and for the stock option award, the Black-Scholes value per share was $14.78. |
| (5) | Mr. Clark is not eligible to participate in the Fiscal 2018 OICP or Fiscal 2018-2020 LTIP, however he remains eligible to participate in the pre-existing Grand Design Management Incentive Plan. |
| Name and Principal Position | Year | Salary ($) | Bonus ($) | Stock Awards(1) ($) | Option Awards(2) ($) | Non-Equity Incentive Plan Compensation(3) ($) | Changes in Pension Value and Non-qualified Deferred Compensation Earnings ($) | All Other Compensation ($)(4) | Total ($) |
| Michael Happe | 2018 | $657,692 | - | $1,242,179 | $414,062 | $855,658 | - | $44,082 | $3,213,673 |
| President, CEO | 2017 | $599,038 | - | $1,004,291 | $247,854 | $902,152 | - | $29,843 | $2,783,178 |
| 2016 | $338,461 | - | $758,835 | $115,800 | $225,280 | - | $2,218 | $1,440,594 | |
| Bryan L. Hughes | 2018 | $457,356 | - | $371,228 | $123,753 | $405,277 | - | $37,446 | $1,395,060 |
| Vice President, CFO | 2017 | $298,846 | - | $451,886 | - | $134,497 | - | $6,370 | $891,599 |
Stacy L. Bogart(5) | 2018 | $271,346 | $50,000 | $701,153 | - | $211,813 | - | $25,248 | $1,259,560 |
| Vice President, General | |||||||||
| Counsel and Secretary | |||||||||
| Donald J. Clark | 2018 | $400,000 | - | - | - | $4,574,055 | - | - | $4,974,055 |
| President, Grand Design | 2017 | $330,769 | - | - | - | $2,700,915 | - | - | $3,031,684 |
| Vice President, Winnebago | |||||||||
| Industries, Inc. | |||||||||
| Brian D. Hazelton | 2018 | $472,588 | - | $365,368 | $121,802 | $173,054 | - | $39,945 | $1,172,757 |
| Vice President and | 2017 | $558,827 | - | $551,208 | $57,260 | $207,298 | - | $23,089 | $1,397,682 |
| General Manager, | |||||||||
| Motorhomes | |||||||||
| Financial Performance Metrics | Threshold | Target | Maximum | ||||||
Net Income (1) | $ | 36,429,040 | $ | 45,536,300 | $ | 54,643,560 | |||
ROIC (2) | 17.2 | % | 21.5 | % | 25.8 | % | |||
| (1) | The |
| Performance-Based Plans | ||||||||||||||
| Name | Fiscal Year | Non-Performance- Based Restricted Stock Grant(a) | Annual Incentive Plans(b) | LTIP / Performance Shares(c) | Total Stock Awards | |||||||||
| Michael J. Happe | 2018 | $ | 414,074 | $ | — | $ | 828,104 | $ | 1,242,179 | |||||
| 2017 | 370,937 | — | 633,354 | 1,004,291 | ||||||||||
| 2016 | 166,700 | 112,648 | 479,487 | 758,835 | ||||||||||
| Bryan L. Hughes | 2018 | 123,743 | — | 247,486 | 371,228 | |||||||||
| 2017 | 280,500 | — | 171,386 | 451,886 | ||||||||||
Stacy L. Bogart (d) | 2018 | 554,500 | — | 146,653 | 701,153 | |||||||||
| 2017 | — | — | — | — | ||||||||||
| Donald J. Clark | 2018 | — | — | — | — | |||||||||
| 2017 | — | — | — | — | ||||||||||
| 2016 | — | — | — | — | ||||||||||
| Brian D. Hazelton | 2018 | 121,789 | — | 243,578 | 365,368 | |||||||||
| 2017 | 292,110 | — | 259,098 | 551,208 | ||||||||||
| 2016 | — | — | — | — | ||||||||||
| (a) | These amounts represent non-performance based restricted stock granted pursuant to the 2014 Plan computed in accordance with ASC 718. The grant date fair value of each of the non-performance based awards was determined at the closing price of the Company's shares on the NYSE on the grant date without regard to estimated forfeitures related to service-based vesting conditions. |
| (b) | The amounts reported in this column do not reflect actual compensation realized by the NEOs in 2016. These amounts represent the fair value of the annual performance-based award, which was required to be paid in stock subject to a one-year holding period under the annual Officers Incentive Compensation Plan ("OICP") for 2016. The 2017 and 2018 OICPs have no stock component and are all cash. |
| (c) | The amounts shown represent the grant date fair value computed in accordance with FASB ASC 718 of the LTIP / performance share awards. The amounts shown for Fiscal |
| (d) | Ms. Bogart joined the Company in January 2018. |
| (2) | The |
Bonus Oppor- tunity (2) | Net Income Financial Factors(3) | ROIC Financial Factors(3) | Total Financial Factors | |||||||
Officer (1) | Threshold | Target | Maximum | Threshold | Target | Maximum | Threshold | Target | Maximum | |
| CEO and President | 100% | 12.25% | 75% | 150% | 4% | 25% | 50% | 16.25% | 100% | 200% |
| Other NEOs | 60% | 12.25% | 75% | 150% | 4% | 25% | 50% | 16.25% | 100% | 200% |
| (3) |
| (4) | Amounts reported in this column for Fiscal 2018 include the |
| Name | Tax and Financial Planning | Car Allowance | Life Insurance Premiums | Dividend(1) | 401(k) Match | Total |
| Michael J. Happe | $8,183 | $18,400 | $952 | $9,277 | $7,270 | $44,082 |
| Bryan L. Hughes | $8,183 | $18,400 | $952 | $5,122 | $4,789 | $37,446 |
| Stacy L. Bogart | $8,183 | $7,846 | $952 | $3,000 | $5,267 | $25,248 |
| Donald J. Clark | _ | _ | _ | _ | _ | _ |
| Brian D. Hazelton | $8,183 | $18,400 | $952 | $4,031 | $8,379 | $39,945 |
| (5) | Ms. Bogart received a new hire stock award of 10,000 shares of restricted stock on January 2, 2018 and a pro-rated FY18-20 LTIP award with a target value of 3,303 shares. She also received a sign-on bonus of $50,000 on January 2, 2018. |
| Name | Bonus Opportunity | Net Income Incentive (1) | ROIC Incentive (2) | Strategic Modifier Incentive (3) | Total Incentive | Amount Paid in Cash (4) | Value Paid in Restricted Stock (4)(5) | ||||||||||||
Michael J. Happe (6) | $ | 338,461 | $ | 253,845 | $ | 71,077 | $ | 12,997 | $ | 337,920 | 225,280 | 112,640 | |||||||
| Sarah N. Nielsen | 201,000 | 150,749 | 42,210 | 7,718 | 200,678 | 133,786 | 66,892 | ||||||||||||
| S. Scott Degnan | 185,768 | 139,325 | 39,011 | 7,133 | 185,471 | 123,647 | 61,824 | ||||||||||||
| Scott C. Folkers | 167,399 | 125,548 | 35,154 | 6,428 | 167,131 | 111,421 | 55,710 | ||||||||||||
| Daryl W. Krieger | 153,601 | 115,200 | 32,256 | 5,898 | 153,355 | 102,237 | 51,118 | ||||||||||||
| Plan Name | Grant Date (3) | Estimated Future Payouts Under Non-Equity Incentive Plan Awards(1) | Estimated Future Payments Under Equity Incentive Plan Awards(2) | All Other Stock Awards: Number of Shares of Stock or Units (#) | All Other Option Awards: Number of Securities Underlying Options (#) | Exercise or Base Price of Option Awards ($/Sh) | Grant Date Fair Value of Stock and Option Awards(4) ($) | ||||||||||||
| Name | Threshold ($) | Target ($) | Maximum ($) | Threshold (#) | Target (#) | Maximum (#) | |||||||||||||
| Michael J. Happe | 2014 Plan | 10/18/17 | 28,015 | $44.40 | $414,062 | ||||||||||||||
| 2014 Plan | 10/18/17 | 9,326 | $414,074 | ||||||||||||||||
| 2018 OICP | 108,000 | 675,000 | 1,350,000 | ||||||||||||||||
| FY18-20 LTIP | 10/18/17 | 1,865 | 18,651 | 27,977 | |||||||||||||||
| Bryan L. Hughes | 2014 Plan | 10/18/17 | 8,373 | $44.40 | $123,753 | ||||||||||||||
| 2014 Plan | 10/18/17 | 2,787 | $123,743 | ||||||||||||||||
| 2018 OICP | 73,800 | 322,875 | 645,750 | — | |||||||||||||||
| FY18-20 LTIP | 10/18/17 | 557 | 5,574 | 8,361 | — | ||||||||||||||
| Stacy L. Bogart | 2014 Plan | - | - | ||||||||||||||||
| 2014 Plan | 1/2/18 | 10,000 | $554,500 | ||||||||||||||||
| 2018 OICP | 26,049 | 162,808 | 325,616 | ||||||||||||||||
| FY18-20 LTIP | 1/2/18 | 330 | 3,303 | 4,954 | |||||||||||||||
Donald J. Clark(5) | |||||||||||||||||||
| Brian D. Hazelton | 2014 Plan | 10/18/17 | 8,241 | $44.40 | $121,802 | ||||||||||||||
| 2014 Plan | 10/18/17 | 2,743 | $121,789 | ||||||||||||||||
| 2018 OICP | 76,384 | 310,310 | 620,620 | ||||||||||||||||
| FY18-20 LTIP | 10/18/17 | 548 | 5,486 | 8,229 | |||||||||||||||
| (1) |
| (2) |
| (3) |
| (4) | The |
| (5) |
| Long-Term Incentive Plans | Date Approved | Bonus Percentage | ROE (3 year cumulative) | Actual ROE | ||||
| Threshold | Target | Maximum | Threshold | Target | Maximum | |||
| Fiscal 2014-2016 (the "2014-2016 Plan") | 6/18/13 | 10% | 100% | 150% | 16.0% | 20.0% | 26.0% | 20.6% |
| Fiscal 2015-2017 (the "2015-2017 Plan") | 6/17/14 | 10% | 100% | 150% | 16.3% | 20.4% | 26.0% | (1) |
| Fiscal 2016-2018 (the "2016-2018 Plan") | 6/16/15 | 10% | 100% | 150% | 12.7% | 15.9% | 19.1% | (2) |
| Name | Target Opportunity (1)(2) | Value of 2014-2016 Plan Award (3) | ||||
| Sarah N. Nielsen | $ | 69,750 | $ | 73,238 | ||
| S. Scott Degnan | 71,750 | 75,338 | ||||
| Scott C. Folkers | 61,500 | 64,575 | ||||
| Daryl W. Krieger | 60,000 | 63,000 | ||||
| Name | Shares granted in Fiscal 2016 | Value (1) | |||
| Michael J. Happe | 10,000 | $ | 166,700 | ||
| Sarah N. Nielsen | 15,000 | 297,750 | |||
| S. Scott Degnan | 15,000 | 297,750 | |||
| Scott C. Folkers | 15,000 | 297,750 | |||
| Daryl W. Krieger | 15,000 | 297,750 | |||
| Name | Ownership Guidelines- Percentage of Annual Salary(1) | Value of Ownership Guidelines (1) | Actual Shares Beneficially Owned (2) | Value of Shares Beneficially Owned (2) | Percentage of Annual Salary Attained(2) | ||||||||||||
| Michael J. Happe | 400 | % | $ | 2,200,000 | 10,000 | $ | 278,900 | 51 | % | (3) | |||||||
| Sarah N. Nielsen | 250 | % | 837,500 | 53,830 | 1,501,319 | 448 | % | ||||||||||
| S. Scott Degnan | 250 | % | 774,035 | 33,860 | 944,355 | 305 | % | ||||||||||
| Scott C. Folkers | 250 | % | 697,498 | 33,717 | 940,367 | 337 | % | ||||||||||
| Daryl W. Krieger | 250 | % | 640,003 | 40,981 | 1,142,960 | 446 | % | ||||||||||
| Name | Year | Salary | Stock Awards (1) | Incentive Plan Compensation(2) | All Other Compensation | Total | ||||||||||
| Michael Happe | 2016 | $ | 338,461 | $ | 279,340 | $ | 225,280 | $ | 332,218 | $ | 1,175,299 | |||||
| President, CEO | ||||||||||||||||
| Robert J. Olson | 2016 | 35,982 | — | — | — | 35,982 | ||||||||||
| Interim CEO | 2015 | 32,194 | — | — | — | 32,194 | ||||||||||
Lawrence A. Erickson(3) | 2016 | — | — | — | — | — | ||||||||||
| Interim CEO | ||||||||||||||||
| Sarah N. Nielsen | 2016 | 335,000 | 434,178 | 133,786 | 14,783 | 917,747 | ||||||||||
| Vice President, CFO | 2015 | 287,370 | 231,677 | 59,074 | 8,660 | 586,781 | ||||||||||
| 2014 | 279,000 | 226,410 | 197,065 | 4,489 | 706,964 | |||||||||||
| S. Scott Degnan | 2016 | 309,614 | 431,422 | 123,647 | 16,288 | 880,971 | ||||||||||
| Vice President/General Manager, | 2015 | 295,611 | 237,010 | 60,769 | 5,375 | 598,765 | ||||||||||
| Towables | 2014 | 287,000 | 166,520 | 202,716 | 4,486 | 660,722 | ||||||||||
| Scott C. Folkers | 2016 | 278,999 | 414,782 | 111,421 | 16,043 | 821,245 | ||||||||||
| Vice President, General Counsel | 2015 | 253,380 | 219,378 | 52,087 | 8,983 | 533,828 | ||||||||||
| and Secretary | ||||||||||||||||
| Daryl W. Krieger | 2016 | 256,001 | 408,704 | 102,237 | 14,718 | 781,660 | ||||||||||
| Vice President, Manufacturing | 2015 | 247,200 | 213,680 | 50,817 | 7,909 | 519,606 | ||||||||||
| Name and Principal Position | Year | Salary ($) | Bonus ($) | Stock Awards(1) ($) | Option Awards(2) ($) | Non-Equity Incentive Plan Compensation(3) ($) | Changes in Pension Value and Non-qualified Deferred Compensation Earnings ($) | All Other Compensation ($)(4) | Total ($) |
| Michael Happe | 2018 | $657,692 | - | $1,242,179 | $414,062 | $855,658 | - | $44,082 | $3,213,673 |
| President, CEO | 2017 | $599,038 | - | $1,004,291 | $247,854 | $902,152 | - | $29,843 | $2,783,178 |
| 2016 | $338,461 | - | $758,835 | $115,800 | $225,280 | - | $2,218 | $1,440,594 | |
| Bryan L. Hughes | 2018 | $457,356 | - | $371,228 | $123,753 | $405,277 | - | $37,446 | $1,395,060 |
| Vice President, CFO | 2017 | $298,846 | - | $451,886 | - | $134,497 | - | $6,370 | $891,599 |
Stacy L. Bogart(5) | 2018 | $271,346 | $50,000 | $701,153 | - | $211,813 | - | $25,248 | $1,259,560 |
| Vice President, General | |||||||||
| Counsel and Secretary | |||||||||
| Donald J. Clark | 2018 | $400,000 | - | - | - | $4,574,055 | - | - | $4,974,055 |
| President, Grand Design | 2017 | $330,769 | - | - | - | $2,700,915 | - | - | $3,031,684 |
| Vice President, Winnebago | |||||||||
| Industries, Inc. | |||||||||
| Brian D. Hazelton | 2018 | $472,588 | - | $365,368 | $121,802 | $173,054 | - | $39,945 | $1,172,757 |
| Vice President and | 2017 | $558,827 | - | $551,208 | $57,260 | $207,298 | - | $23,089 | $1,397,682 |
| General Manager, | |||||||||
| Motorhomes | |||||||||
| (1) | The table below illustrates the three categories of stock awards as presented |
| Performance-Based Plans | ||||||||||||||
| Name | Fiscal Year | Non-Performance- Based Restricted Stock Grant(a) | Annual Incentive Plans(b) | Long-Term Incentive Plans(c) | Total | |||||||||
| Michael J. Happe | 2016 | $ | 166,700 | $ | 112,640 | $ | — | $ | 279,340 | |||||
| Sarah N. Nielsen | 2016 | 297,750 | 66,678 | 69,750 | 434,178 | |||||||||
| 2015 | 109,650 | 57,474 | 64,553 | 231,677 | ||||||||||
| 2014 | 109,120 | 55,800 | 61,490 | 226,410 | ||||||||||
| S. Scott Degnan | 2016 | 297,750 | 61,922 | 71,750 | 431,422 | |||||||||
| 2015 | 109,650 | 59,122 | 68,238 | 237,010 | ||||||||||
| 2014 | 109,120 | 57,400 | — | 166,520 | ||||||||||
| Scott C. Folkers | 2016 | 297,750 | 55,532 | 61,500 | 414,782 | |||||||||
| 2015 | 109,650 | 50,676 | 59,052 | 219,378 | ||||||||||
| Daryl W. Krieger | 2016 | 297,750 | 50,954 | 60,000 | 408,704 | |||||||||
| 2015 | 109,650 | 49,440 | 54,590 | 213,680 | ||||||||||
| Performance-Based Plans | ||||||||||||||
| Name | Fiscal Year | Non-Performance- Based Restricted Stock Grant(a) | Annual Incentive Plans(b) | LTIP / Performance Shares(c) | Total Stock Awards | |||||||||
| Michael J. Happe | 2018 | $ | 414,074 | $ | — | $ | 828,104 | $ | 1,242,179 | |||||
| 2017 | 370,937 | — | 633,354 | 1,004,291 | ||||||||||
| 2016 | 166,700 | 112,648 | 479,487 | 758,835 | ||||||||||
| Bryan L. Hughes | 2018 | 123,743 | — | 247,486 | 371,228 | |||||||||
| 2017 | 280,500 | — | 171,386 | 451,886 | ||||||||||
Stacy L. Bogart (d) | 2018 | 554,500 | — | 146,653 | 701,153 | |||||||||
| 2017 | — | — | — | — | ||||||||||
| Donald J. Clark | 2018 | — | — | — | — | |||||||||
| 2017 | — | — | — | — | ||||||||||
| 2016 | — | — | — | — | ||||||||||
| Brian D. Hazelton | 2018 | 121,789 | — | 243,578 | 365,368 | |||||||||
| 2017 | 292,110 | — | 259,098 | 551,208 | ||||||||||
| 2016 | — | — | — | — | ||||||||||
| (a) | These amounts represent non-performance based restricted stock granted pursuant to the |
| (b) | The amounts reported in this column do not reflect actual compensation realized by the NEOs |
| (c) | The |
| (d) | Ms. Bogart joined the Company in January 2018. |
| (2) | The amounts shown represent the aggregate grant date fair values of the option grants. Assumptions used in the calculation of the amounts reported in this column are included in Note 12 to the financial statements included in our 2018 Form 10-K. |
| (3) | These amounts represent actual annual incentive plan award payouts made in cash to NEOs under the 2016, 2017 and 2018 OICPs. In the case of Mr. Clark, these amounts do not represent award payouts under such OICPs, but instead represent award payouts under the pre-existing Grand Design Management Incentive Plan that he participates in. |
| (4) | Amounts reported in this column for Fiscal 2018 include the following: |
| Name | Tax and Financial Planning | Car Allowance | Life Insurance Premiums | Dividend(1) | 401(k) Match | Total |
| Michael J. Happe | $8,183 | $18,400 | $952 | $9,277 | $7,270 | $44,082 |
| Bryan L. Hughes | $8,183 | $18,400 | $952 | $5,122 | $4,789 | $37,446 |
| Stacy L. Bogart | $8,183 | $7,846 | $952 | $3,000 | $5,267 | $25,248 |
| Donald J. Clark | _ | _ | _ | _ | _ | _ |
| Brian D. Hazelton | $8,183 | $18,400 | $952 | $4,031 | $8,379 | $39,945 |
| (5) | Ms. Bogart received a new hire stock award of 10,000 shares of restricted stock on January 2, 2018 and a pro-rated FY18-20 LTIP award with a target value of 3,303 shares. She also received a sign-on bonus of $50,000 on January 2, 2018. |
| Plan Name | Grant Date (3) | Estimated Future Payouts Under Non-Equity Incentive Plan Awards(1) | Estimated Future Payments Under Equity Incentive Plan Awards(2) | All Other Stock Awards: Number of Shares of Stock or Units (#) | All Other Option Awards: Number of Securities Underlying Options (#) | Exercise or Base Price of Option Awards ($/Sh) | Grant Date Fair Value of Stock and Option Awards(4) ($) | ||||||||||||
| Name | Threshold ($) | Target ($) | Maximum ($) | Threshold (#) | Target (#) | Maximum (#) | |||||||||||||
| Michael J. Happe | 2014 Plan | 10/18/17 | 28,015 | $44.40 | $414,062 | ||||||||||||||
| 2014 Plan | 10/18/17 | 9,326 | $414,074 | ||||||||||||||||
| 2018 OICP | 108,000 | 675,000 | 1,350,000 | ||||||||||||||||
| FY18-20 LTIP | 10/18/17 | 1,865 | 18,651 | 27,977 | |||||||||||||||
| Bryan L. Hughes | 2014 Plan | 10/18/17 | 8,373 | $44.40 | $123,753 | ||||||||||||||
| 2014 Plan | 10/18/17 | 2,787 | $123,743 | ||||||||||||||||
| 2018 OICP | 73,800 | 322,875 | 645,750 | — | |||||||||||||||
| FY18-20 LTIP | 10/18/17 | 557 | 5,574 | 8,361 | — | ||||||||||||||
| Stacy L. Bogart | 2014 Plan | - | - | ||||||||||||||||
| 2014 Plan | 1/2/18 | 10,000 | $554,500 | ||||||||||||||||
| 2018 OICP | 26,049 | 162,808 | 325,616 | ||||||||||||||||
| FY18-20 LTIP | 1/2/18 | 330 | 3,303 | 4,954 | |||||||||||||||
Donald J. Clark(5) | |||||||||||||||||||
| Brian D. Hazelton | 2014 Plan | 10/18/17 | 8,241 | $44.40 | $121,802 | ||||||||||||||
| 2014 Plan | 10/18/17 | 2,743 | $121,789 | ||||||||||||||||
| 2018 OICP | 76,384 | 310,310 | 620,620 | ||||||||||||||||
| FY18-20 LTIP | 10/18/17 | 548 | 5,486 | 8,229 | |||||||||||||||
| (1) | Fiscal 2018 OICP targets annual performance against goals established by the Committee. Awards under the Fiscal 2018 OICP are payable in cash. The Threshold, Target and Maximum amounts presented above represent amounts that could have been earned by our NEOs for Fiscal 2018 under the Fiscal 2018 OICP. Ms. Bogart's Fiscal 2018 OICP has been prorated to reflect her January 2018 start date. |
| (2) | Fiscal 2018-2020 LTIP refers to our performance shares. For each of the NEOs, the Threshold, Target and Maximum amounts under the Fiscal 2018-2020 LTIP represent potential performance stock |
| (3) | The Human Resource Committee approved the Fiscal 2018 OICP and Fiscal 2018-2020 LTIP plans on October 18, 2017, effective as of August 27, 2017. |
| (4) | The grant date value per share of the restricted stock was $44.40 on October 18, 2017 and $55.40 on January 2, 2018, and for the stock option award, the Black-Scholes value per share was $14.78. |
| (5) | Mr. Clark is not eligible to |
Plan Name(1)(2) | Grant Date (3) | Estimated Future Payouts Under Non-Equity Incentive Plan Awards | Estimated Future Payments Under Equity Incentive Plan Awards | All Other Stock Awards (#) | All Other Option Awards Under-lying Securities (#) | Grant Date Fair Value of Stock and Option Awards | ||||||||||||||||
| Name | Threshold | Target | Maximum | Threshold | Target | Maximum | ||||||||||||||||
| Michael J. Happe | 2014 Plan | 1/18/16 | 10,000 | $ | 16.67 | |||||||||||||||||
| 2014 Plan | 1/18/16 | 10,000 | 5.31 | |||||||||||||||||||
| 2016 OICP | 6/16/15 | 36,608 | 225,280 | 451,282 | 18,304 | 112,640 | 225,641 | |||||||||||||||
| Sarah N. Nielsen | 2014 Plan | 10/13/15 | — | — | — | — | — | — | 15,000 | 19.85 | ||||||||||||
| 2016 OICP | 6/16/15 | 21,775 | 134,000 | 268,000 | 10,888 | 66,678 | 134,000 | — | — | |||||||||||||
| 2018 LTIP | 6/16/15 | — | — | — | 8,375 | 83,750 | 125,625 | — | — | |||||||||||||
| S. Scott Degnan | 2014 Plan | 10/13/15 | — | — | — | — | — | — | 15,000 | 19.85 | ||||||||||||
| 2016 OICP | 6/16/15 | 20,125 | 123,846 | 247,691 | 10,063 | 61,922 | 123,846 | — | — | |||||||||||||
| 2018 LTIP | 6/16/15 | — | — | — | 7,740 | 77,404 | 116,105 | — | — | |||||||||||||
| Scott C. Folkers | 2014 Plan | 10/13/15 | — | — | — | — | — | — | 15,000 | 19.85 | ||||||||||||
| 2016 OICP | 6/16/15 | 18,135 | 111,600 | 223,200 | 9,068 | 55,532 | 111,600 | — | — | |||||||||||||
| 2018 LTIP | 6/16/15 | — | — | — | 6,975 | 69,750 | 104,625 | — | — | |||||||||||||
| Daryl W. Krieger | 2014 Plan | 10/13/15 | — | — | — | — | — | — | 15,000 | 19.85 | ||||||||||||
| 2016 OICP | 6/16/15 | 16,640 | 102,400 | 204,800 | 8,320 | 50,954 | 102,400 | — | — | |||||||||||||
| 2018 LTIP | 6/16/15 | — | — | — | 6,400 | 64,000 | 96,000 | — | — | |||||||||||||
Option Awards(1) | Stock Awards(2) | ||||||||||||
| Name | Number of Securities Underlying Unexercised Exercisable Options (#) | Option Exercise Price ($) | Option Expiration Date | Number of Shares or Units of Stock That Have Not Vested(3) (#) | Market Value of Shares or Units of Stock That Have Not Vested(4) ($) | ||||||||
| Michael J. Happe | 10,000 | $16.67 | 1/18/26 | 10,000 | $ | 239,100 | |||||||
| Sarah N. Nielsen | — | — | — | 19,668 | 470,262 | ||||||||
| S. Scott Degnan | — | — | — | 19,668 | 470,262 | ||||||||
| Scott C. Folkers | — | — | — | 19,668 | 470,262 | ||||||||
| Daryl W. Krieger | — | — | — | 19,668 | 470,262 | ||||||||
| Option Awards | Stock Awards | LTIP / Performance Shares | ||||||
| Name | Number of Securities Underlying Unexercised Options (#) Exercisable | Number of Securities Underlying Unexercised Options (#) Unexercisable | Option Exercise Price ($) | Option Expiration Date | Number of Shares or Units of Stock That Have Not Vested(3) (#) | Market Value of Shares or Units of Stock That Have Not Vested(4)(9) ($) | Equity Incentive Plan Awards: Number of Unearned Shares, Units or Other Rights That Have Not Yet Vested | Equity Incentive Plan Awards: Market or Payout Value of Unearned Shares, Units or Other Rights That Have Not Vested(10) |
| Michael J. Happe | 4,433 | 8,867 (1) | $27.89 | 10/11/2026 | 21,527 (4) | $802,957 | ||
| 6,666 | 3,334 (2) | $16.67 | 1/18/2026 | 12,855(6) | $479,492 | |||
| 5,666 | 11,334 (3) | $35.50 | 12/13/2026 | 22,709 (7) | $847,046 | |||
| - | 28,015 (4) | $44.40 | 10/18/2027 | 18,651 (8) | $695,682 | |||
| Bryan L. Hughes | - | 8,737 (4) | $44.40 | 10/18/2027 | 9,454 (4) | $352,634 | 6,110 (7) | $227,903 |
5,574 (8) | $207,910 | |||||||
| Stacy L. Bogart | - | - | 10,000 (4) | $373,000 | 3,303 (8) | $123,202 | ||
| Donald J. Clark | - | - | $0.00 | - | - | - | - | |
| Brian D. Hazelton | 2,333 | 4,667 (1) | $27.89 | 10/11/2026 | - | - | 9,290 (7) | $346,517 |
| - | 8,241 (4) | $44.40 | 10/18/2027 | 10,077 (4) | $375,872 | 5,486 (8) | $204,628 | |
| (1) | Represents |
| (2) | Represents stock |
| (3) | Represents stock granted on December 13, 2016 as a grant for the purchase of Grand Design RV under the 2014 Plan, which will vest with respect to 33% of the shares covered by the option on each of the first three anniversaries of the grant date. |
| (4) | Represents stock granted on October 18, 2017 as an annual stock grant under the 2014 Plan, which will vest with respect to 33% of the shares covered by the option on each of the first three anniversaries of the grant date. |
| (5) | Represents stock granted on January 2, 2018 as a new hire grant under the Omnibus Plan, which will vest with respect to 1/3 of the shares on the first anniversary of the date of grant. |
| (9) | Represents the value of |
| (10) | Represents the |
| Option Awards | Stock Awards | ||||||||
| Name | Number of Shares Acquired on Exercise (#) | Value Realized on Exercise ($) | Number of Shares Acquired on Vesting (#) | Value Realized on Vesting ($)(1) | |||||
| Sarah N. Nielsen | — | — | 11,600 | 229,730 | |||||
| S. Scott Degnan | — | — | 11,877 | 235,229 | |||||
| Daryl W. Krieger | — | — | 10,756 | 212,977 | |||||
| Scott C. Folkers | — | — | 11,074 | 219,289 | |||||
| Option Awards | Stock Awards | ||||||||
| Name | Number of Shares Acquired on Exercise (#) | Value Realized on Exercise ($) | Number of Shares Acquired on Vesting (#) | Value Realized on Vesting ($)(1) | |||||
| Michael J. Happe | — | — | 7,766 | 360,968 | |||||
| Bryan Hughes | — | — | 3,333 | 120,821 | |||||
| Brian Hazelton | — | — | 3,666 | 148,374 | |||||
| (1) | Valued at the closing market price of the Company's Common Stock of |
| FY 2016 Activity | ||||||||||||||||
| Name | Plan Name | Aggregate Balance at Aug 29, 2015 | Executive Contributions | Aggregate Earnings | Aggregate Withdrawals/Distributions | Aggregate Balance at Aug 27, 2016(1) | ||||||||||
| Sarah N. Nielsen | Executive Deferred Compensation Plan | $ | 27,581 | $ | 16,915 | $ | 2,671 | $ | — | $ | 47,167 | |||||
| Daryl W. Krieger | Executive Deferred Compensation Plan | 43,468 | 35,609 | 4,225 | — | 83,302 | ||||||||||
| Change of Control | ||||||||||||||||||
| Executive Payments and Benefits Upon | Retirement(1) or Voluntary Separation | Involuntary Termination For Cause | Without Termination | Termination Without Cause / Good Reason | Death | Disability | ||||||||||||
| Compensation: | ||||||||||||||||||
Severance Benefit (Change of Control)(2) | $ | — | $ | — | $ | — | $ | 3,025,797 | $ | — | $ | — | ||||||
| Annual Incentives: | ||||||||||||||||||
Annual Incentive Plan(3) | 337,920 | 337,920 | 337,920 | (Included Above) | 337,920 | 337,920 | ||||||||||||
| Long-Term Incentives: | ||||||||||||||||||
LTIP(4) | — | — | 542,929 | 542,929 | — | — | ||||||||||||
Restricted Stock:(5) | ||||||||||||||||||
| Accelerated Vesting | — | 239,100 | 239,100 | 239,100 | 239,100 | 239,100 | ||||||||||||
Stock Options:(6) | ||||||||||||||||||
| Accelerated Vesting | — | 72,400 | 72,400 | 72,400 | 72,400 | 72,400 | ||||||||||||
| Total Benefits | $ | 337,920 | $ | 649,420 | $ | 1,192,349 | $ | 3,880,226 | $ | 649,420 | $ | 649,420 | ||||||
| Name | Severance(1) | Annual or Manage-ment Incentive Plan(2) | LTIP / Performance Shares(3) | Restricted Stock-Unvested and Accelerated(4) | Stock Options-Unvested and Accelerated(5) | Total Benefits | ||||||||||||||||||
| Michael J. Happe | ||||||||||||||||||||||||
Retirement(6) or Voluntary Separation | $ | — | $ | — | $ | — | $ | — | $ | — | $ | — | ||||||||||||
| Involuntary Termination for Cause | — | — | — | — | — | — | ||||||||||||||||||
Change of Control:(7) | — | |||||||||||||||||||||||
| Without Termination | — | — | $1,940,966 | $802,951 | $172,620 | $2,916,537 | ||||||||||||||||||
| Termination WIthout Cause/Good Reason | $4,878,721 | $855,658 | $1,940,966 | $802,951 | $172,620 | $8,650,916 | ||||||||||||||||||
| Death | — | $855,658 | — | — | — | $855,658 | ||||||||||||||||||
| Disability | — | $855,658 | — | — | — | $855,658 | ||||||||||||||||||
| Bryan L. Hughes | ||||||||||||||||||||||||
Retirement(6) or Voluntary Separation | — | — | — | — | — | — | ||||||||||||||||||
| Involuntary Termination for Cause | — | — | — | — | — | — | ||||||||||||||||||
Change of Control:(7) | ||||||||||||||||||||||||
| Without Termination | — | — | $417,894 | $352,634 | — | $770,528 | ||||||||||||||||||
| Termination WIthout Cause/Good Reason | $2,125,196 | $405,277 | $417,894 | $352,634 | — | $3,301,001 | ||||||||||||||||||
| Death | — | $405,277 | — | — | — | $405,277 | ||||||||||||||||||
| Disability | — | $405,277 | — | — | — | $405,277 | ||||||||||||||||||
| Stacy L. Bogart | ||||||||||||||||||||||||
Retirement(6) or Voluntary Separation | — | — | — | — | — | — | ||||||||||||||||||
| Involuntary Termination for Cause | — | — | — | — | — | — | ||||||||||||||||||
Change of Control:(7) | ||||||||||||||||||||||||
| Without Termination | — | — | $146,653 | $373,000 | — | $519,653 | ||||||||||||||||||
| Termination WIthout Cause/Good Reason | $1,597,497 | $211,813 | $146,653 | $373,000 | — | $2,328,963 | ||||||||||||||||||
| Death | — | $211,813 | — | — | — | $211,813 | ||||||||||||||||||
| Disability | — | $211,813 | — | — | — | $211,813 | ||||||||||||||||||
| Donald J. Clark | ||||||||||||||||||||||||
Retirement(6) or Voluntary Separation | — | — | — | — | — | $4,574,055 | ||||||||||||||||||
| Involuntary Termination for Cause | — | — | — | — | — | $4,574,055 | ||||||||||||||||||
Change of Control:(7) | — | |||||||||||||||||||||||
| Without Termination | — | — | — | — | — | — | ||||||||||||||||||
| Termination WIthout Cause/Good Reason | $12,008,609 | — | — | — | — | $12,008,609 | ||||||||||||||||||
| Death | — | $4,574,055 | — | — | — | $4,574,055 | ||||||||||||||||||
| Disability | — | $4,574,055 | — | — | — | $4,574,055 | ||||||||||||||||||
| Brian D. Hazelton | ||||||||||||||||||||||||
Retirement(6) or Voluntary Separation | — | — | — | — | — | — | ||||||||||||||||||
| Involuntary Termination for Cause | — | — | — | — | — | |||||||||||||||||||
Change of Control:(7) | ||||||||||||||||||||||||
| Without Termination | — | — | $502,676 | $375,872 | $43,916 | $922,464 | ||||||||||||||||||
| Termination WIthout Cause/Good Reason | $2,340,211 | $173,054 | $502,676 | $375,872 | $43,916 | $3,435,729 | ||||||||||||||||||
| Death | — | $173,054 | — | — | — | $173,054 | ||||||||||||||||||
| Disability | — | $173,054 | — | — | — | $173,054 | ||||||||||||||||||
| (1) |
| Severance upon a Change of Control equals an amount equal to three times the average of the aggregate annual compensation paid during our three fiscal years immediately preceding the Change of Control and excludes any payments required to cover IRC Section 280G obligations if applicable. Upon the execution of our revised Change in Control Agreements prior to December 31, 2018, severance equals an amount equal to two times (or three times in the case of our CEO) base salary and target annual incentive for executives party to these agreements. |
| Represents the NEOs' annual incentive eligibility pursuant to the |
| Represents the LTIP incentive achieved pursuant to the |
| Represents the intrinsic value of stock grants based on our closing stock price of |
| Represents the intrinsic value of stock options based on our closing stock price of |
| Change of Control | ||||||||||||||||||
| Executive Payments and Benefits Upon | Retirement(1) or Voluntary Separation | Involuntary Termination For Cause | Without Termination | Termination Without Cause / Good Reason | Death | Disability | ||||||||||||
| Compensation: | ||||||||||||||||||
Severance Benefit (Change of Control)(2) | $ | — | $ | — | $ | — | $ | 1,845,047 | $ | — | $ | — | ||||||
| Annual Incentives: | ||||||||||||||||||
Annual Incentive Plan(3) | 200,678 | 200,678 | 200,678 | (Included Above) | 200,678 | 200,678 | ||||||||||||
| Long-Term Incentives: | ||||||||||||||||||
LTIP(4) | 73,238 | 73,238 | 278,097 | 278,097 | 73,238 | 73,238 | ||||||||||||
Restricted Stock:(5) | ||||||||||||||||||
| Accelerated Vesting | — | 470,262 | 470,262 | 470,262 | 470,262 | 470,262 | ||||||||||||
| Deferred Compensation Plans: | ||||||||||||||||||
Executive Deferred Compensation Plan(6) | 47,167 | 47,167 | 47,167 | 47,167 | 47,167 | 47,167 | ||||||||||||
| Total Benefits | $ | 321,083 | $ | 791,345 | $ | 996,204 | $ | 2,640,573 | $ | 791,345 | $ | 791,345 | ||||||
| Retirement under certain of the |
| Change of Control | ||||||||||||||||||
| Executive Payments and Benefits Upon | Retirement(1) or Voluntary Separation | Involuntary Termination For Cause | Without Termination | Termination Without Cause / Good Reason | Death | Disability | ||||||||||||
| Compensation: | ||||||||||||||||||
Severance Benefit (Change of Control)(2) | $ | — | $ | — | $ | — | $ | 1,765,177 | $ | — | $ | — | ||||||
| Annual Incentives: | ||||||||||||||||||
Annual Incentive Plan(3) | 185,471 | 185,471 | 185,471 | (Included Above) | 185,471 | 185,471 | ||||||||||||
| Long-Term Incentives: | ||||||||||||||||||
LTIP(4) | 75,338 | 75,338 | 266,523 | 266,523 | 75,338 | 75,338 | ||||||||||||
Restricted Stock:(5) | ||||||||||||||||||
| Accelerated Vesting | — | 470,262 | 470,262 | 470,262 | 470,262 | 470,262 | ||||||||||||
| Total Benefits | $ | 260,809 | $ | 731,071 | $ | 922,256 | $ | 2,501,962 | $ | 731,071 | $ | 731,071 | ||||||
| Change of Control | ||||||||||||||||||
| Executive Payments and Benefits Upon | Retirement(1) or Voluntary Separation | Involuntary Termination For Cause | Without Termination | Termination Without Cause / Good Reason | Death | Disability | ||||||||||||
| Compensation: | ||||||||||||||||||
Severance Benefit (Change of Control)(2) | $ | — | $ | — | $ | — | $ | 1,592,885 | $ | — | $ | — | ||||||
| Annual Incentives: | ||||||||||||||||||
Annual Incentive Plan(3) | 167,131 | 167,131 | 167,131 | (Included Above) | 167,131 | 167,131 | ||||||||||||
| Long-Term Incentives: | ||||||||||||||||||
LTIP(4) | 64,575 | 64,575 | 237,121 | 237,121 | 64,575 | 64,575 | ||||||||||||
Restricted Stock:(5) | ||||||||||||||||||
| Accelerated Vesting | — | 470,262 | 470,262 | 470,262 | 470,262 | 470,262 | ||||||||||||
| Total Benefits | $ | 231,706 | $ | 701,968 | $ | 874,514 | $ | 2,300,268 | $ | 701,968 | $ | 701,968 | ||||||
| Change of Control | ||||||||||||||||||
| Executive Payments and Benefits Upon | Retirement(1) or Voluntary Separation | Involuntary Termination For Cause | Without Termination | Termination Without Cause / Good Reason | Death | Disability | ||||||||||||
| Compensation: | ||||||||||||||||||
Severance Benefit (Change of Control)(2) | $ | — | $ | — | $ | — | $ | 1,589,056 | $ | — | $ | — | ||||||
| Annual Incentives: | ||||||||||||||||||
Annual Incentive Plan(3) | 153,355 | 153,355 | 153,355 | (Included Above) | 153,355 | 153,355 | ||||||||||||
| Long-Term Incentives: | ||||||||||||||||||
LTIP(4) | 63,000 | 63,000 | 63,000 | 63,000 | 63,000 | 63,000 | ||||||||||||
Restricted Stock:(5) | ||||||||||||||||||
| Accelerated Vesting | — | 470,262 | 470,262 | 470,262 | 470,262 | 470,262 | ||||||||||||
| Deferred Compensation Plans: | ||||||||||||||||||
Executive Deferred Compensation Plan(6) | 83,302 | 83,302 | 83,302 | 83,302 | 83,302 | 83,302 | ||||||||||||
| Total Benefits | $ | 299,657 | $ | 769,919 | $ | 769,919 | $ | 2,205,620 | $ | 769,919 | $ | 769,919 | ||||||
As of August 25, 2018(1) | After Approval of 2019 Plan | ||||||
Shares Reserved for Issuance of Outstanding Awards(1) | Shares Available for Future Awards | Shares Reserved for Issuance of Outstanding Awards | Shares Available for Future Awards | ||||
2004 Plan(2) | 9,000 | 0 | 6,500 | 0 | |||
2014 Plan(2) | 469,704 | 1,677,481 | 353,347 | 0 | |||
| 2019 Plan | 0 | 0 | 0 | 4,100,000(3) | |||
| Total | 478,704 | 1,677,481 | 359,847 | 4,100,000(3) | |||
| Types of Awards | ||||||
| Options/SARs | Full Value Awards | Weighted Average Exercise Price of Options/SARs | Shares Available for Future Awards | |||
2004 Plan(2) | 0 | 0 | N/A | 0 | ||
2014 Plan(2) | 138,510 | 331,194 | 36.68 | 0 | ||
| (a) | (b) | (c) | |
| Plan Category | Number of Securities to be Issued Upon Exercise of Outstanding Options, Warrants and Rights | Weighted Average Exercise Price of Outstanding Options, Warrants and Rights(1 ($) | Number of Securities Remaining Available for Future Issuance Under Equity Compensation Plans (Excluding Securities Reflected in (a)) |
| Equity compensation plans approved by shareholders - 2004 Plan | 9,000(2) | - | — |
| Equity compensation plans approved by shareholders - 2014 Plan | 469,704(3) | 36.68 | 1,677,481(4) |
Equity compensation plans not approved by shareholders(5) | 47,366(6) | - | (7) |
| Total | 387,920 | 36.68 | 1,677,481 |
| The Audit | ||
| Maria F. Blase | ||
| William C. Fisher | ||
| David W. Miles | ||
| Fiscal 2016 | Fiscal 2015 | Fiscal 2018 | Fiscal 2017 | |||||||||||
Audit Fees (1) | $ | 682,000 | $ | 585,000 | $ | 1,051,000 | $ | 1,162,000 | ||||||
Audit-Related Fees (2) | 171,000 | 23,000 | 26,000 | 303,000 | ||||||||||
Tax Fees (3) | 6,670 | 76,371 | — | — | ||||||||||
All Other Fees (4) | — | — | — | — | ||||||||||
| Total | $ | 859,670 | $ | 684,371 | $ | 1,077,000 | $ | 1,465,000 | ||||||
| (1) | Represents fees for professional services provided for the audit of our annual financial statements, the audit of our internal control over financial reporting, |
| (2) | Represents fees for professional services provided for the audit of our benefit plan and due diligence services. |
| (3) | Represents fees for professional services related to tax compliance and tax planning. |
| (4) | Represents fees for professional services provided to us not otherwise included in the categories above. |
| By Order of the Board of Directors | |
| October | /s/ |
| Vice President - General Counsel | |
| and Secretary | |
| |

| |
 | |